

1
Read it, then acknowledge it
- Each alert names its kind and job, when first seen, when last confirmed, and a detail line of counts or error text.
- Click Acknowledge: the banner turns from yellow to blue and gains an Acknowledged badge.
- Acknowledging is bookkeeping, not a fix: the alert stays until its check passes.
- For a Job failed, find the job on the Scheduled jobs panel and click Recent runs: a failed run shows its error and what the job recorded, and View all runs in Supabase has the full history. A single failed run between clean ones already healed.

Checkpoint: alert acknowledged and matched to its row in the table.
The next three steps are three different outages. Do the one that matches and skip the others.
2
Outage 1: a paused Supabase project
- Free-tier Supabase projects pause themselves, and everything scheduled stops with them, billing included. The symptom: Job stalled across the daily jobs.
- The fix: unpause the project in Supabase and watch the Scheduled jobs panel for runs landing again; keep your organization on Pro so it can’t recur.
- Billing catches up on its own: the next hourly billing run after your Daily billing time sweeps everything that came due.
Catch-up can’t double-charge. Each due cycle bills exactly once, even when catch-up lands more than one on the same day.
Checkpoint: jobs green again.
3
Outage 2: the app unreachable
- When your Vercel deployment goes down, the portal goes dark and queued work backs up: Job stalled opens for Notification sender within 30 minutes, then Queue lagging.
- Billing is unaffected: it runs inside your database, not the app.
- The fix: check the latest deployment in your Vercel dashboard. Once the app answers, the queues drain themselves; no replay, no cleanup.
Checkpoint: app back, queues empty.
4
Outage 3: a 503 after an update
- A 503 that says Database schema out of date means new code deployed before its database migrations ran.
- The fix is the migrate step of Update the platform: run
npm run merchant:migrate, then reload the site.
Checkpoint: the site answers again.
5
Check the integration connections panel
- Integration connections checks every connected provider live against its own servers: the same checks each card’s Test connection button runs.
- Healthy: the saved credentials verified just now. Failing: the provider rejected them or never answered (after three tries); the row says which, and View logs in that provider opens its console. Connected just means there’s no live check to run.
- Each row also counts the last 24 hours’ failures in both directions (errored calls from the provider, rejected sends to it), with the latest messages quoted underneath.
- Update available just means a newer one-click setup shipped; the row links to Integrations to apply it. On the Shopify rows, Current is the aim, Update available resolves with a normal platform update, and Unsupported means update soon.
- Checks refresh in the background (the line under the panel says when), so give a fix a couple of minutes to show.
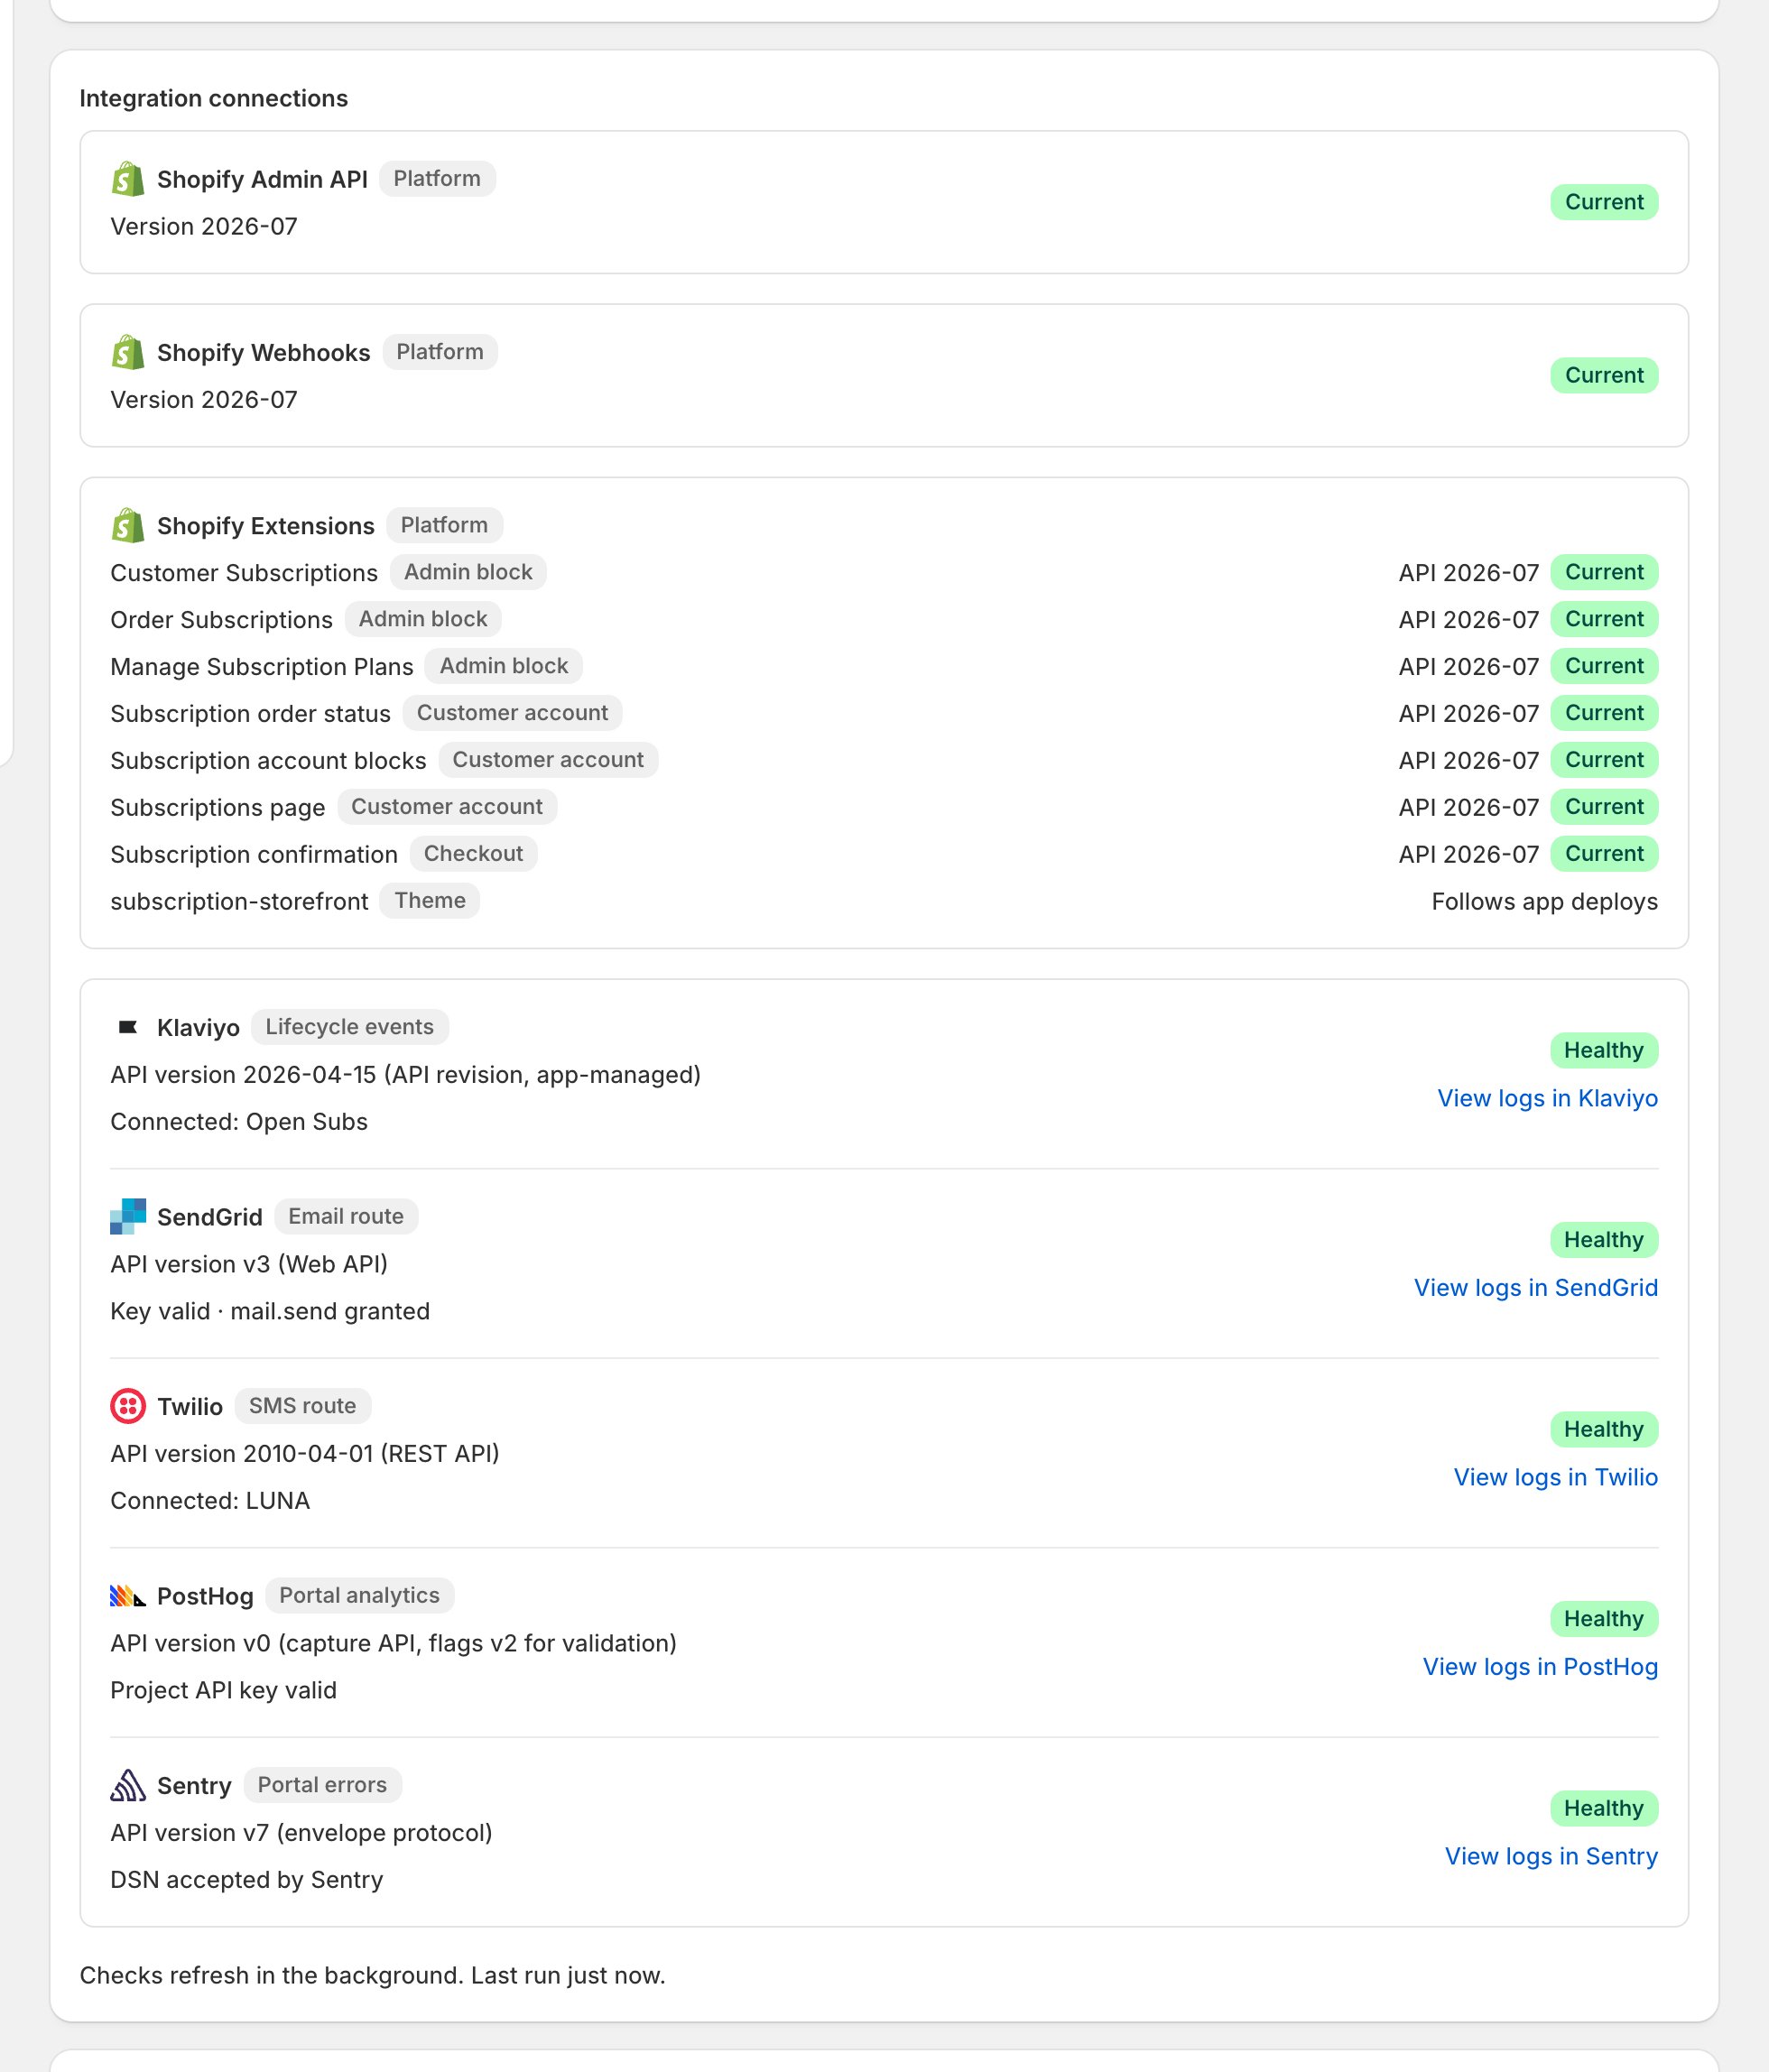
Checkpoint: every row Healthy or Connected, nothing Failing.
6
Check the webhook delivery panel
- Webhook delivery (24h) counts what Shopify told your platform, topic by topic; Recent failures (7d) lists the latest with their error text.
- The occasional failed row heals itself: Shopify retries failed deliveries on its own.
- Sustained failures across many topics are the real signal: check your Supabase project’s Edge Function logs, then hand the error text to whoever runs your code.
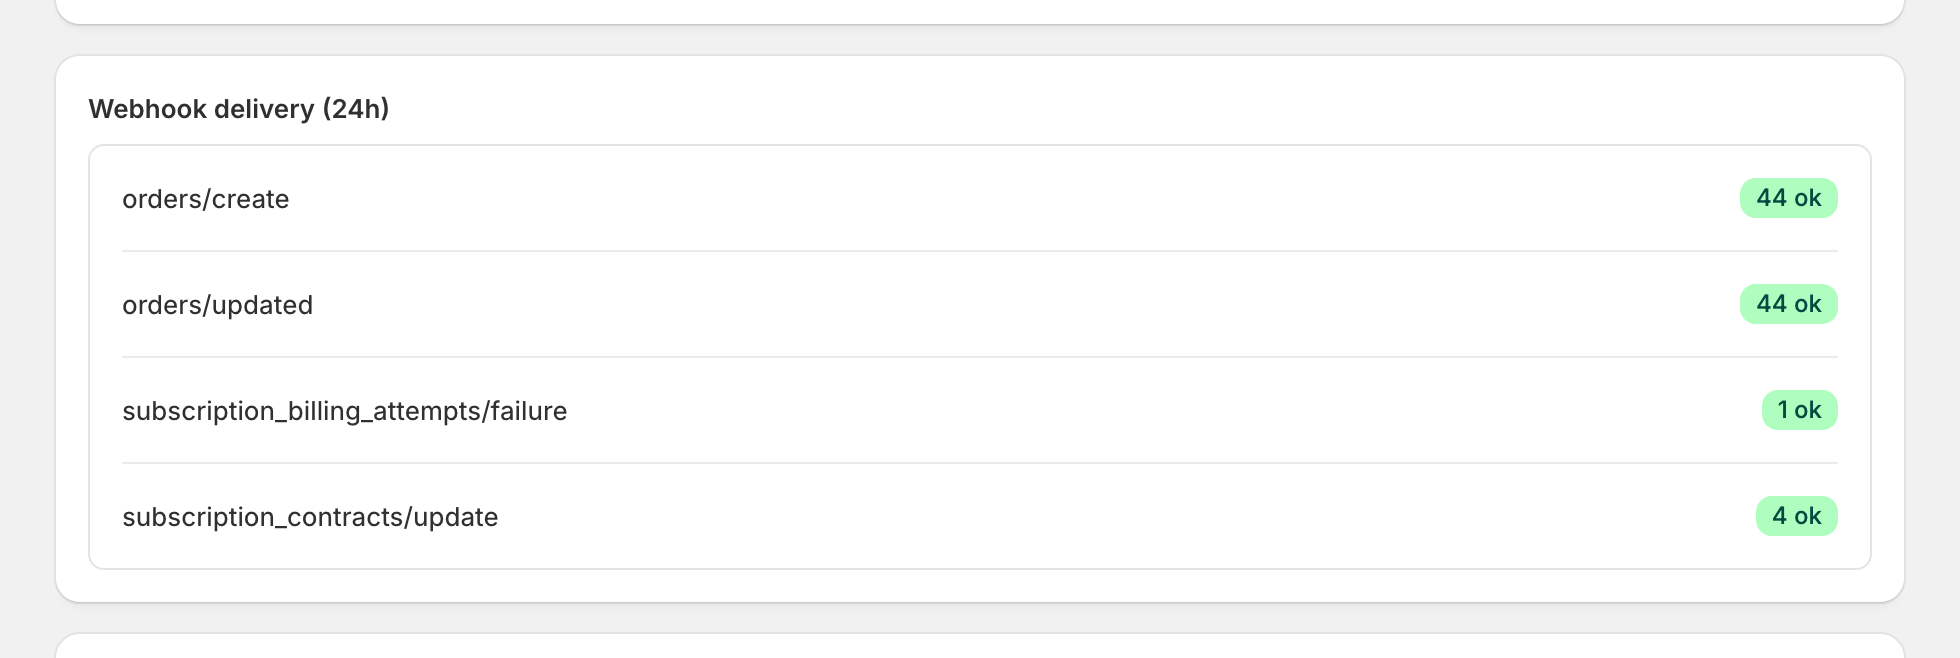
Checkpoint: failed counts falling, not climbing.